
No meet-up for May


Stay warm, stay healthy
Apologies, friends, but there's no meet-up again this month. This coronavirus life is a bitch, no?
We're keen to have conversations that take us away from the doomscrolling, so we're prepping some great chats for the next half of the year.
Don't forget we're always keen to hear ideas for meet-ups! You can drop us an email or check out our website if you want to pitch something.

ICYMI
📊 For those who had RSVP'd for this month, here's a consolation meet-up — it looks amazing, but you'll need to be awake at 3am to listen in
🗺️ The Public Interest Journalism Initiative is mapping newsroom closures around the country. I'm keen to know if anyone out there is taking this a step further and looking at (or maybe just gathering) the ages of journalists affected by these closures? Tweet us or drop us an email if you can help
💻 The ACCC has some ideas about how the media industry in Australia could be compensated by the likes of Facebook and Google for the use of their content
🦗 A plague of locusts is chowing through crops in East Africa and the Middle East, threatening the food security of millions. Torrential rainfall across the region last year resulted in a vegetation boom and created the perfect environment for locusts to breed like crazy
🎧 For our podcasting fans out there, this is a really interesting analysis of what the Joe Rogan/Spotify deal could mean for the wider industry
About last month...
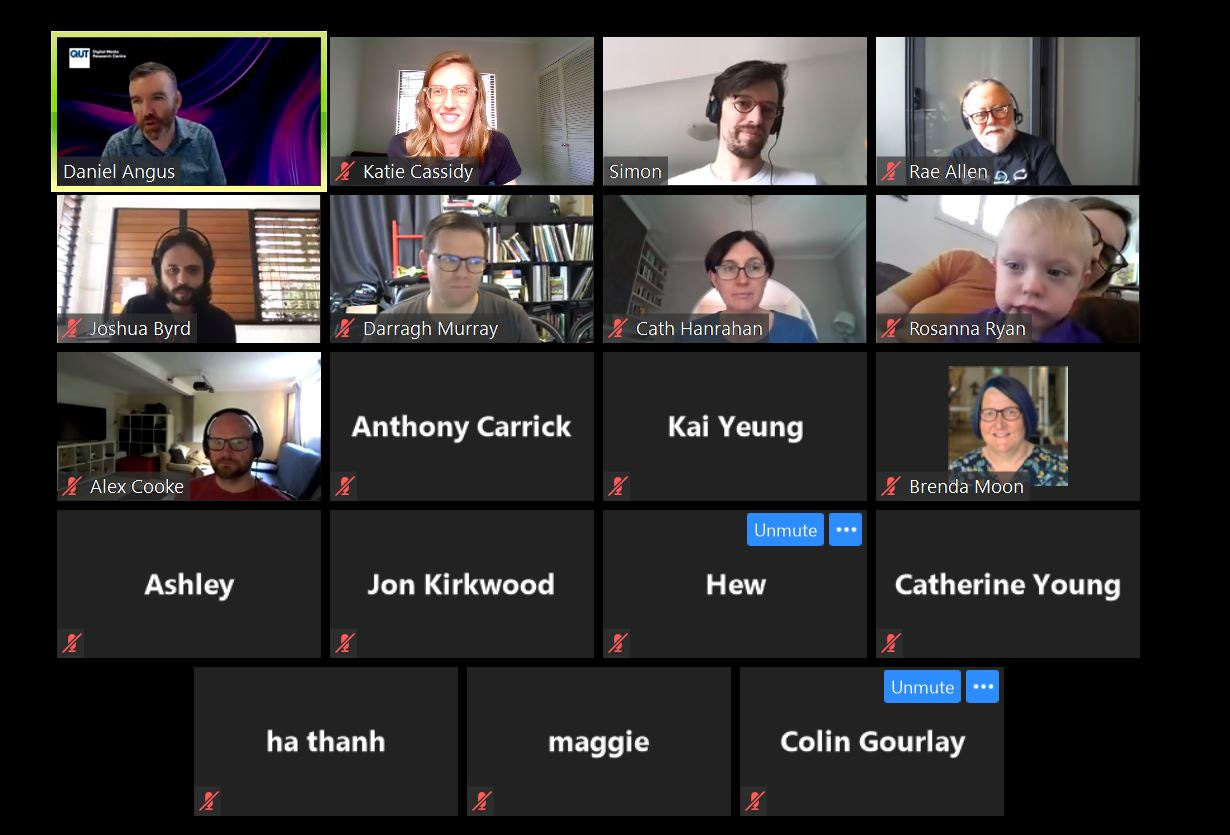
Thanks everyone who joined out first virtual meet-up! We all agreed it was a huge success ✌️
Hacks/Hackers' Dan Angus and Simon Elvery chatted with the ABC's Cath Hanrahan about visualising pandemic data and the challenges that come with that. Here are some key points from the discussion:
Cath said it was clear that people were interested in what was happening in Australia vs the rest of the world – especially as the pandemic continued. But a big challenge has been that data about infections and deaths is reported differently in different countries, and testing regimes are also different
Dan spoke about this early offering, saying it was very broad and asking: how do we narrow down information for people who want to know what’s happening in their city or their suburb? It’s so difficult to tell a story to people who are looking for something specific from the data
Cath added that early on, there was no data about specific areas, and there was a perception that the Government didn’t want people to panic. But that changed when it became clear that more information was a good thing and the data could help with the message of, "you need to stay home"
But there's also a challenge there around helping people make sense of all the data. Simon spoke about the Financial Times's John Burn-Murdoch - who was publishing data very early on - and his efforts to respond to people on Twitter who were asking him "why do it this way, rather than that way?"
Simon spoke about this ABC story and visualisation that he and Cath worked on, in which they wanted to explain to people how a logarithmic graph works. "We are breaking down the chart – what happens when you change from a linear to a log scale," he said
Cath said while the pandemic was massively disrupting our lives, it was great that so much focus was being put on viruses – what they do, how they affect you, and also the broader issue of vaccinations. "It's great that there’s a deeper appetite for understanding that, which can only be a good thing," she added
Some of the other interesting visualisations and resources shared by the group included this one from the NY Times about missing deaths, Our World In Data from Oxford Uni, and this stats tracker